The World Top Incomes Database statistics for the USA are here.
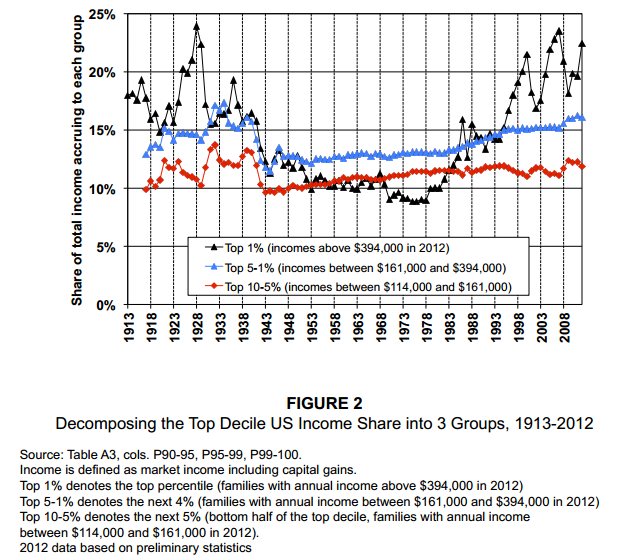
Top 1% income share-including capital gains          22.46%
Top 0.01% income share-including capital gains             5.47%
Top 10% minimum income level (family /household)      114,000 Real 2012 US Dollars
Top 5% minimum income level (family /household)       161,000 Real 2012 US Dollars
Top 1% minimum income level (family/household)        394,000 Real 2012 US Dollars
Top 0.01% minimum income level (family/household)  10,250,000 Real 2012 US Dollars (16068 families)
Top 1% average income                               1,021,761 Real 2012 US Dollars
Top 0.01% average income                           21,569,156 Real 2012 US Dollars
Top 1% average income-including capital gains       1,264,065 Real 2012 US Dollars
Top 0.01% average income-including capital gains   30,785,699 Real 2012 US Dollars


Canada’s Top Income Statistics for 2010
Link to Canada’s statistics in the World Top Income Database.
Top 1% income share-LAD                           12.22%
Top 0.01% income share-LAD                         1.44%
Top 1% income share-including capital gains-LAD   13.62%
Top 0.01% income share-including capital gains-LAD 1.7%
Top 1% average income-LAD                          351,500 Real 2000 Canadian Dollars
Top 0.01% average income-LAD                     4,147,600 Real 2000 Canadian Dollars
Switzerland’s Top Income Statistics for 2009
Link to Switzerland’s statistics in the World Top Income Database.
Top 1% income share                               10.54%
Top 0.01% income share                             1.73%
Top 1% average income                               707,571 Real 2010 CHF
Top 0.01% average income                         11,634,874 Real 2010 CHF
China Top Income Statistics for 2003 based on a survey
Link to China’s statistics in the World Top Income Database.
Top 1% income share                                5.87%
Top 1% average income                              77,295 Real 2000 Yuans
Ranking information by net worth and not incomes
The total world wealth distribution
The top 1% in the USA by net worth
The average (median) American family has pre-tax income in the low to mid-$50k range and net worth around $120k.
High end professionals at 99 to 99.5 percentile
The 99th to 99.5th percentiles largely include physicians, attorneys, upper middle management, and small business people who have done well. Everyone’s tax situation is, of course, a little different, but on earned income in this group, we can figure that somewhere around 25% to 30% of total pre-tax income will go to Federal, State, and Social Security taxes — leaving them with around $250k to $300k post-tax. This group makes extensive use of 401(k)s, SEP-IRAs, Defined Benefit Plans, and other retirement vehicles, which defer taxes until distribution during retirement. Typical would be yearly contributions in the $50k to $100k range, leaving our elite working group with yearly cash flows of $175k to $250k after taxes, or about $15k to $20k per month.
Data on net worth distributions within the top 1% indicate that one enters the top 0.5% with about $1.8M, the top 0.25% with $3.1M, the top 0.10% with $5.5M and the top 0.01% with $24.4M.
If someone retires with $5M today, roughly the beginning rung for entry into the top 0.1%, they can reasonably expect an income of $240k pretax and around $190k post tax, including Social Security.
While income and lifestyle are all relative, an after-tax income between $6.6k and $8.3k per month today will hardly buy the fantasy lifestyles that Americans see on TV and would consider “rich”. In many areas in California or the East Coast, this positions one squarely in the hard working upper-middle class, and strict budgeting will be essential. An income of $190k post tax or $15.8k per month will certainly buy a nice lifestyle but is far from rich.
The top half and, particularly, top 0.1%, can often borrow for almost nothing, keep profits and production overseas, hold personal assets in tax havens, ride out down markets and economies, and influence legislation in the U.S. They have access to the very best in accounting firms, tax and other attorneys, numerous consultants, private wealth managers, a network of other wealthy and powerful friends, lucrative business opportunities, and many other benefits.
The Upper Half of the Top 1%
Membership in this elite group is likely to come from being involved in some aspect of the financial services or banking industry, real estate development involved with those industries, or government contracting. Some hard working and clever physicians and attorneys can acquire as much as $15M-$20M before retirement but they are rare. Those in the top 0.5% have incomes over $500k if working and a net worth over $1.8M if retired. The higher we go up into the top 0.5% the more likely it is that their wealth is in some way tied to the investment industry and borrowed money than from personally selling goods or services or labor as do most in the bottom 99.5%. They are much more likely to have built their net worth from stock options and capital gains in stocks and real estate and private business sales, not from income which is taxed at a much higher rate. These opportunities are largely unavailable to the bottom 99.5%.
Folks in the top 0.1% come from many backgrounds but it’s infrequent to meet one whose wealth wasn’t acquired through direct or indirect participation in the financial and banking industries. [One of the Investment manager’s] client, net worth in the $60M range, built a small company and was acquired with stock from a multi-national. Stock is often called a “paper” asset. Another client [of the Investment manager who wrote the USCD.edu article], CEO of a medium-cap tech company, retired with a net worth in the $70M range. The bulk of any CEO’s wealth comes from stock, not income, and incomes are also very high. In 2010, the average S and P 500 CEO made $9M in all forms of compensation.
2014 top 1% had an average investment net worth somewhere around $3 million at the end of 2013 based on IRS numbers
One enters the top 1% today with an income around $400k and the top 0.1% with an income around $2.5M. The top 1% had an average investment net worth somewhere around $3 million at the end of 2013 based on IRS numbers, and $6 million based on Federal Reserve numbers.
One might think that physicians, America’s highest-paid professional group, would be largely exempt from the economic currents affecting most other Americans. This isn’t so. Medscape, a key physician website, reports that as of 2013, mean income for male physicians in all specialties was $259k; for female physicians, it was $199k. Family practice doctors and internists earned the least, averaging around $175k. Orthopedic surgeons earned the most, averaging around $405k; they are the only physician specialty falling within the top 1% by income. If we assume an income of $259k before taxes, our male physician filing jointly would bring home about $200k after taxes annually (or about $16,600 per month). In most of the U.S., it is likely that living well, raising a family, and other expenses would make it difficult to save more than $4,000 to $5,000 per month, or around $50k to $60k per year.
If our hypothetical physician saves and invests for 35 years, he will have contributed less than $2 million dollars to retirement plans; with growth over time, the absolute number will be larger but the purchasing power of each dollar will be less. Future returns in investment markets are somewhat unpredictable, as is inflation. Thus, an average physician — while doing very well by most people’s standards — is unlikely to earn or accumulate enough to place him or her in the top 1% by income or net worth at the end of their career
If you liked this article, please give it a quick review on ycombinator or StumbleUpon. Thanks

Brian Wang is a Futurist Thought Leader and a popular Science blogger with 1 million readers per month. His blog Nextbigfuture.com is ranked #1 Science News Blog. It covers many disruptive technology and trends including Space, Robotics, Artificial Intelligence, Medicine, Anti-aging Biotechnology, and Nanotechnology.
Known for identifying cutting edge technologies, he is currently a Co-Founder of a startup and fundraiser for high potential early-stage companies. He is the Head of Research for Allocations for deep technology investments and an Angel Investor at Space Angels.
A frequent speaker at corporations, he has been a TEDx speaker, a Singularity University speaker and guest at numerous interviews for radio and podcasts. He is open to public speaking and advising engagements.