
An article Motley Fool, lists out 50 facts which show that overall human civilization is now living through its greatest period. Trends are still improving and we could do better if more cities and countries were willing to intelligently copy what works and fix things that are clearly badly broken.
The facts cover improved automotive safety, medicine and public health results, productivity and income levels and other facts.
Automotive safety is being further improved with better systems at intersections where most accidents occur and with driver assist electronic systems.
Fact 49 – Income levels and income inequality
In 2008, an annual income of $34,000 a year was required to be in the richest 1% of the world, according to World Bank economist Branko Milanovic’s 2010 book The Haves and the Have-Nots. To be in the top half of the globe you needed to earn just $1,225 a year. For the top 20%, it’s $5,000 per year. Enter the top 10% with $12,000 a year. To be included in the top 0.1% requires an annual income of $70,000. America’s poorest are some of the world’s richest.
This was covered in Milanovic’s book and summarized in this Worldbank article.
Poverty and inequality is research and analysis is at this Worldbank site
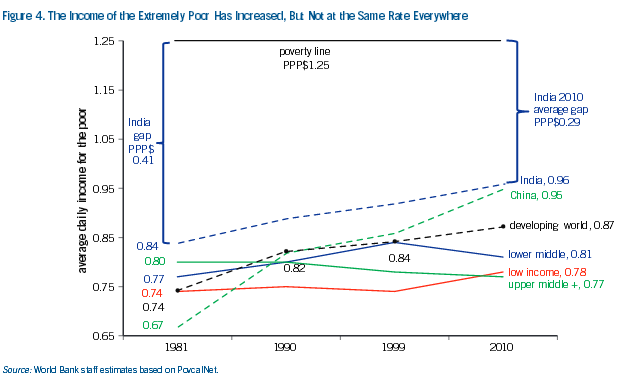
Better data and analysis to end global extreme poverty by 2030 [defined as getting to less than 3% of the world population]
If we had a magic wand and could perfectly target every extremely poor individual, and magically raise their incomes to the $1.25 per day extreme poverty line, in 2010 the world needed approximately $169 billion per year (in 2005 PPP dollars) to end extreme poverty. The value of the Aggregate Poverty Gap, however, is not the same as the cost of ending extreme poverty. It is the size of the problem which is different from the size (cost) of the solution.
Another way of interpreting the APG/GDP ratio is the following: Suppose that the real GDP growth for the developing world as a whole is 5 percent per year. If 10 percent of this GDP growth accrued to the 21 percent of the developing world’s population who are extremely poor, and this 10 percent was distributed in a way that the growth in income of each poor person was exactly his/her distance to the $1.25 line, extreme poverty would end in one year.

The primary data source for the profiles of the poor is the I2D2, a globally harmonized database drawn from more than 600 nationally representative household surveys. Poverty profiling is commonly conducted at the country level, where country-specific definition of poverty is used. Our approach, which we call “Global Poverty Profiling,” is unique in that we focus on profiles of the poor defined by the international poverty line of $1.25 a day, thereby allowing us to compare socioeconomic and geographical characteristics of the extremely poor across countries.
Even the I2D2 is not free from data limitations described above and those widely documented in the poverty literature, including but not limited to the issue of comparability due to different survey designs across time and locations and that of Purchasing Power Parity Index used to convert local currencies to the international one. While we are aware of these limitations, we believe it is of great importance to make the most of available data and produce the best available estimates of the state of the poor as part of our renewed mission to end extreme poverty by 2030.


Over the past 25 years, the world has made a lot of progress. We have gone from 43 percent of the people living in absolute poverty to 21 percent today. But most of that was because China grew so rapidly. They lifted 600 million people out of poverty. It’s never been done before in human history.
But now the tough work remains. What we’re seeing is a one-percent-a-year drop in global poverty, but what’s going to happen is that that curve is going to flatten out, and flatten out pretty dramatically. And what we’re saying is, we now need to bend that arc downwards and really end poverty.
Uttar Pradesh is a state in India that has over 200 million people. Eight percent of the people living in absolute poverty in the world live in Uttar Pradesh.
We believe that the evidence shows us — and certainly the Arab spring countries have shown us this — that if you have GDP growth without inclusion, you’re building instability into your societies. And we feel that the evidence is overwhelming that putting women at the center of the development process, for example, is smart economics.
India has a one trillion dollar infrastructure deficit over the next five years.
World official development assistance, which is the money that donor countries give, is about $125 billion dollars a year.
India, China and middle income countries staying on track, will leave the problem mainly in Fragile Countries
Strong education and health systems are essential to growth and extreme poverty reduction, but people in fragile states are : more than three times as likely to be unable to send their children to school; more than twice as likely to be under-nourished ; and twice as likely to see their children die before age five.
The outlook is more promising, however, for countries that do escape fragility and conflict. According to World Bank classifications, 11 countries have graduated from fragile state status since 2004 while achieving average economic growth rates of 4.3 percent. Countries like Cambodia, Laos, Mozambique, Rwanda, Uzbekistan, and Vietnam experienced rapid economic growth following periods of severe political instability.
The “neighborhood effect” may negatively impact the ability to reduce poverty across a region. Evidence shows that countries with neighbors experiencing civil wars suffer ed losses in GDP growth equal to 0.7 percentage points per year on average. Additionally, fragile states tend to be geographically clustered. However, even in regions where conflict-affected fragile states border others with no armed conflict , political instability and armed conflict in one country can generate subsequent unrest and instability in neighboring and regional countries as well as economic ripple effects through the region. Thus, the impact of a neighborhood war may have deleterious effects on extreme poverty in peaceful neighboring states. More recent research shows an even higher annual loss of 1.5 percentage points of economic growth for countries that border a “Low Income Country Under Stress”. Since these countries typically lose about 2.3 percentage points but have an average of three neighboring countries, the region’s aggregate losses are much higher than losses to the country itself
If you liked this article, please give it a quick review on ycombinator or StumbleUpon. Thanks

Brian Wang is a Futurist Thought Leader and a popular Science blogger with 1 million readers per month. His blog Nextbigfuture.com is ranked #1 Science News Blog. It covers many disruptive technology and trends including Space, Robotics, Artificial Intelligence, Medicine, Anti-aging Biotechnology, and Nanotechnology.
Known for identifying cutting edge technologies, he is currently a Co-Founder of a startup and fundraiser for high potential early-stage companies. He is the Head of Research for Allocations for deep technology investments and an Angel Investor at Space Angels.
A frequent speaker at corporations, he has been a TEDx speaker, a Singularity University speaker and guest at numerous interviews for radio and podcasts. He is open to public speaking and advising engagements.