

Forbes has an article by James Conca about deaths per trillion kwh (1000 terawatt hours) by energy source. James is a senior scientist with the RJLee Group, and Director of their Center for Laboratory Sciences in Pasco, WA.
The numbers are a combination of actual direct deaths and epidemiological estimates, and are rounded to two significant figures. I have adjusted prior numbers.
Previously I had included coal for all uses electricity, heating and cooking.
Energy Source               Mortality Rate (deaths/trillionkWhr)

Coal (elect,heat,cook–world avg)100,000 (26% of world energy, 50% of electricity)
Coal electricity – world avg     60,000 (26% of world energy, 50% of electricity)
Coal (elect,heat,cook – China)  170,000
Coal electricity-  China         90,000
Coal – U.S.                      15,000    (44% U.S. electricity)
Oil                              36,000    (36% of energy, 8% of electricity)
Natural Gas                       4,000    (20% global electricity)
Biofuel/Biomass                  24,000    (21% global energy)
Solar (rooftop)                     440    (0.2% global electricity)
Wind                                150    (1.6% global electricity)
Hydro – global average            1,400    (15% global electricity)
Nuclear – global average             90    (17%  global electricity w/Chern&Fukush)
The units are 1000 times larger (1000 twh instead of twh.) than what I used.
Energy Source              Death Rate (deaths per TWh)

Coal (elect, heat,cook –world avg) 100 (26% of world energy, 50% of electricity)
Coal electricity – world avg        60 (26% of world energy, 50% of electricity)
Coal (elect,heat,cook)– China      170
Coal electricity-  China            90
Coal – USA                          15
Oil                                 36  (36% of world energy)
Natural Gas                          4  (21% of world energy)
Biofuel/Biomass                     12
Peat                                12
Solar (rooftop)                      0.44 (0.2% of world energy for all solar)
Wind                                 0.15 (1.6% of world energy)
Hydro                                0.10 (europe death rate, 2.2% of world energy)
Hydro - world including Banqiao)     1.4 (about 2500 TWh/yr and 171,000 Banqiao dead)
Nuclear                              0.04 (5.9% of world energy)
I had to adjust the coal deaths in China and world average. Previous numbers were for outdoor air pollution. This is 60% for coal for electricity, cooking and heating in China. Pollution is 30% from coal powerplants in China for the particulates and 66% for sulfur dioxide. Mining accidents, transportation accidents are mostly from coal for electricity.
He cited Seth Godin for his article which was a summary of my article. Which I wrote back in 2008 and have updated several times.
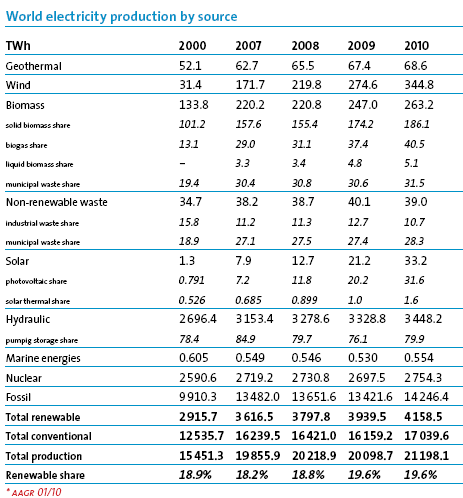
Worldwide solar production was at 33.2 TWh in 2010.
Worldwide wind production as at 344.8 TWh output in 2010.
Worldwide hydro production was at 3,448.2 TWh in 2010.
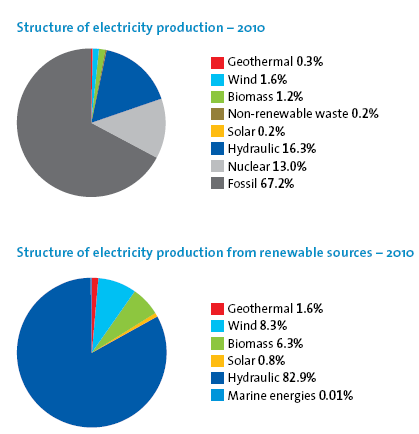
World Electricity production statistics from 2010
Deaths per twh article I wrote in 2008
Background information and analysis
Around 20 articles on deaths per twh and lifetime deaths per twh.
An update on the research seems to be that coal particulates are being contained better in China. Still not as well as in the USA.
China is one of the few countries with some of the highest particulate matter levels in the world. However, only a small number of particulate matter health studies have been conducted in China. The study objective was to examine the association of particulate matter with an aerodynamic diameter of less than 10 μm (PM10) with daily mortality in 16 Chinese cities between 1996 and 2008. Two-stage Bayesian hierarchical models were applied to obtain city-specific and national average estimates. Poisson regression models incorporating natural spline smoothing functions were used to adjust for long-term and seasonal trends of mortality, as well as other time-varying covariates. The averaged daily concentrations of PM10 in the 16 Chinese cities ranged from 52 μg/m3 to 156 μg/m3. The 16-city combined analysis showed significant associations of PM10 with mortality: A 10-μg/m3 increase in 2-day moving-average PM10 was associated with a 0.35% (95% posterior interval (PI): 0.18, 0.52) increase of total mortality, 0.44% (95% PI: 0.23, 0.64) increase of cardiovascular mortality, and 0.56% (95% PI: 0.31, 0.81) increase of respiratory mortality. Females, older people, and residents with low educational attainment appeared to be more vulnerable to PM10 exposure. Conclusively, this largest epidemiologic study of particulate air pollution in China suggests that short-term exposure to PM10 is associated with increased mortality risk.


There is a trend towards improvement in air quality in Chinese cities.
– They are updating boilers and using low sulfur coal.
– They are moving industry away from major cities
– They are setting up coal free regions in cities
– They have set up construction site dust control
– They are improving and increasing emission standards for powerplants and vehicles.
Yale Environment 360 (2012) has information on the sources of air pollution for Beijing.
In January, a vice mayor of Beijing shared some figures for sources of Beijing air pollution. Of course, it is hard to independently verify these figures. But according to the local official, at least 22 percent is from car emissions, 16.7 percent from coal combustion, 16 percent from building and road construction dust and particles, 6.3 percent from industrial emissions, 4.5 from the burning of corn and wheat stocks and other activities in nearby rural areas. And 24.5 percent of Beijing smog comes from surrounding urban and industrial areas, including Tianjin and Hebei. That’s what the vice mayor says, anyway.
Air Pollution Threatens the Health of Children in China (2008, 11 pages)
China’s power plants and industry emit 600 tons of mercury into the atmosphere each year, making China the source of nearly one quarter of the world’s anthropogenic emissions of mercury. In contrast, the United States produced 120 tons of atmospheric mercury in 1999. Disproportionately high use of coal in heavy
industry in China’s central provinces such as Shaanxi, Guizhou, Henan, and Sichuan has resulted in these regions having the highest emissions of mercury. Coal combustion is responsible for an estimated 46% of
Chongqing’s total mercury emissions.
Sources of Atmospheric Pollution for Mongolia (2011, 12 pages)

Coal Combustion type 1 was from power plants and Coal combustion type 2 was from home heating and burning
Source Characterization and Apportionment of PM10 in Panzhihua, China (10 pages, 2007)
Coal combustion as a result of electricity generation, industrial processing and residential use is a significant particulate source category for ambient PM10. Three subtype sources, namely MGSMY, PPMY and SMMY, were collected and the composite profile was constructed. MGSMY samples were collected at a power plant that uses gangue as fuel. PPMY and SMMY coal fly ash was emitted by coal-fired power plants and through residential use respectively. The three profiles for subtypes of coal combustion ash are all dominated by Al (6.3–17.9%), Si (9.8–10.3%) and TC (9–37.4%). The high variability of the three leading species indicates that subtypes of coal combustion ash can be chemically distinguished. This may be due to the use of different kinds of coal and different combustion patterns.
With regard to annual PM10, coal combustion ash is found to be the major particulate contributor, accounting for 25.8% of the ambient concentration. Iron and steel industry dust is the next greatest contributor, accounting for 19.5% of annual PM10. Vehicle exhaust and secondary SO42– are the two other significant sources, accounting for 13.7% and 12.2% of PM10 respectively. The four source categories constitute the majority (about 70%) of ambient PM10. Minor particulate categories include SOC (7.8%), geological dust (6.7%), construction dust (3.3%) and secondary NO3–, (2.7%). No more than 8.3% of PM10 mass was contributed by unknown sources.
China’s Health and Environment: Air pollution and health effects (1998)
Industry accounts for two thirds of China’s coal use – industrial boilers alone consume 30 percent of China’s coal. These boilers are usually highly inefficient and emit through low smoke stacks, contributing to much of China’s ground-level air pollution, especially small particulates and SO2. Inefficient and dirty boilers are particularly problematic because many of the industries that use them are located in densely populated metropolitan areas, placing populations in these areas at high risk of exposure. The residential sector accounts for approximately 15 percent of total coal use, yet is estimated to contribute to more than 30 percent of urban ground-level air pollution
Summarizing the Sources of Particulate air pollution in China
The range is for different cities and areas in China.
Coal power plants seem to be a source for 15-35% of particulate air pollution in China (average about 20%)
Heating 15-35% of the of particulate air pollution in China (average about 20%)
Industrial boilers in China about 15-20% of particulate air pollution in China (average 16%)
Cars are another major source 12-25% of particulate air pollution in China. (average 15%)
The biggest and wealthiest cities Beijing, Shanghai, Guangzhou have the higher number of 22-25% for cars and usually coal plants and industry are less because the national government has put effort to shift from coal power away and to shift industry away from rich big cities.
For coal, oil and biomass, it is carbon particulates resulting from burning that cause upper respiratory distress, kind of a second-hand black lung. Our lungs just don’t like burnt carbonaceous particulates, whether from coal or wood or manure or pellets or cigarettes. The actual numbers of deaths in China from coal use exceeded 300,000 last year since they have ramped up coal so fast in the last decade and they usually do not install exhaust scrubbers. The impact on their health care system has been significant in not just deaths, but in non-lethal health effects and lost days of work.
References:
P. Bickel and R. Friedrich, Externalities of Energy, European Union Report EUR 21951, Luxembourg (2005).
A. J. Cohen et al., The global burden of disease due to outdoor air pollution, Journal of Toxicology and Environmental Health, Part A, 68: 1301-1307 (2005)
NAS, Hidden Costs of Energy: Unpriced Consequences of Energy Production and Use Committee on Health, Environmental, and Other External Costs and Benefits of Energy Production and Consumption; Nat. Res. Council, Wash., D.C. ISBN: 0-309-14641-0 (2010).
C. A. Pope et al., Lung cancer, cardiopulmonary mortality, and long-term exposure to fine particulate air pollution. Journal of the AMA, 287 (9): 1132-1141 (2002).
J. Scott et al., The Clean Air Act at 35, Environmental Defense, New York, www.environmentaldefense.org. (2005).
WHO, Health effects of chronic exposure to smoke from Biomass Fuel burning in rural areas, Chittaranjan National Cancer Institute (2007) cnci.academia.edu/1123846/
If you liked this article, please give it a quick review on ycombinator or StumbleUpon. Thanks

Brian Wang is a Futurist Thought Leader and a popular Science blogger with 1 million readers per month. His blog Nextbigfuture.com is ranked #1 Science News Blog. It covers many disruptive technology and trends including Space, Robotics, Artificial Intelligence, Medicine, Anti-aging Biotechnology, and Nanotechnology.
Known for identifying cutting edge technologies, he is currently a Co-Founder of a startup and fundraiser for high potential early-stage companies. He is the Head of Research for Allocations for deep technology investments and an Angel Investor at Space Angels.
A frequent speaker at corporations, he has been a TEDx speaker, a Singularity University speaker and guest at numerous interviews for radio and podcasts. He is open to public speaking and advising engagements.
Comments are closed.