

AIS is Accelerated Improvement Scenario, CIS is Continued Improvement Scenario, IEA Equiv. refers to converting ERI’s numbers to IEA equivalent given that ERI follows the convention of using power generation equivalent, rather than IEA and LBNL’s use of calorific equivalent, to convert primary electricity. This results in a 3.01 lower gross energy content for renewables and biomass.
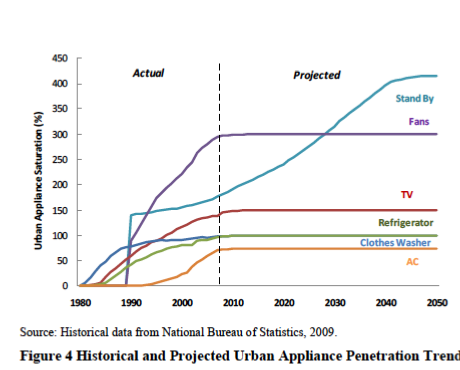
According to this new forecast, the steeply rising curve of energy demand in China will begin to moderate between 2030 and 2035 and flatten thereafter. There will come a time—within the next two decades—when the number of people in China acquiring cars, larger homes, and other accouterments of industrialized societies will peak. It’s a phenomenon known as saturation. “Once nearly every household owns a refrigerator, a washing machine, air conditioners and other appliances, and once housing area per capita has stabilized, per household electricity growth will slow,’’ Levine explains.
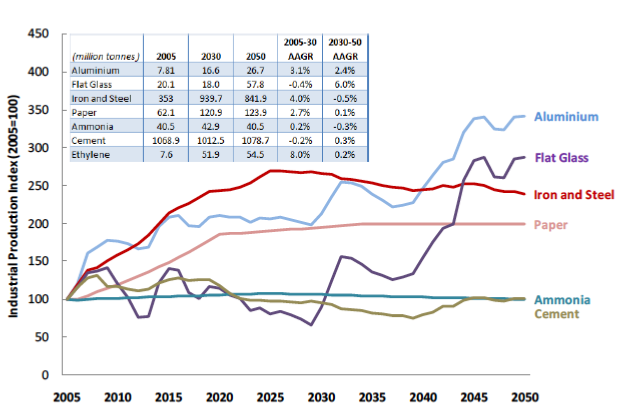
China will reach saturation in road and rail construction before the 2030-2035 time frame, resulting in very large decreases in iron and steel demand. Additionally, other energy-intensive industries will see demand for their products flatten.
China’s Energy and Carbon Emissions Outlook to 2050 (83 pages)


LBNL projection for GDP per capita in China, market rate is in real US$, while data for other countries are in GDP per capita PPP, 2000 US$. Sources: Energy Research Institute, 2009; IEA, 2009.
The Berkeley Lab report also anticipates the widespread use of electric cars, a significant drop in reliance on coal for electricity generation, and a big expansion in the use of nuclear power—all helping to drive down China’s CO2 emissions.
The report examine demand for appliances such as refrigerators and fans, it also makes predictions about adoption of improvements in the energy efficiency of such equipment – just as Americans are now buying more efficient washing machines, cars with better gas-mileage, and less power-hungry light bulbs.
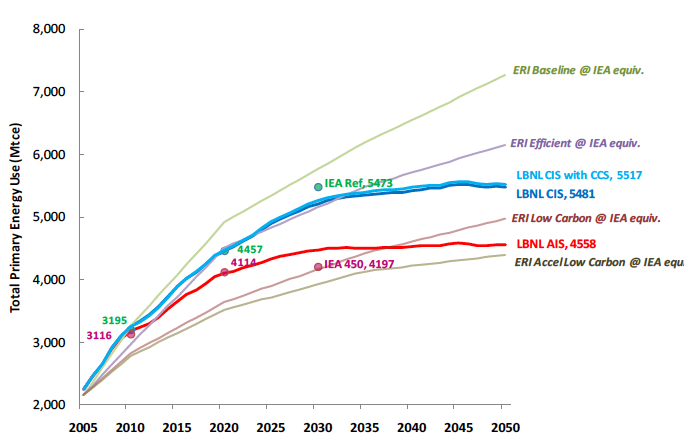
Their study is a “scenario analysis” that forecasts two possible energy futures for China, one an “accelerated improvement scenario” that assumes success for a very aggressive effort to improve energy efficiency, the other a more conservative “continued improvement scenario” that meets less ambitious targets.


Under the more aggressive scenario, energy consumption begins to flatten in 2025, just 14 years from now. The more conservative scenario sees energy consumption rates beginning to taper in 2030. By the mid-century mark, energy consumption under the “accelerated improvement scenario” will be 20 percent below that of the other.
Scenario analysis is also used in more conventional forecasts, but these are typically based on macroeconomic variables such as gross domestic product and population growth. Such scenarios are developed “without reference to saturation, efficiency, or usage of energy-using devices, e.g., air conditioners,’’ says the Berkeley Lab report. “For energy analysts and policymakers, this is a serious omission, in some cases calling into question the very meaning of the scenarios.’’
The new Berkeley Lab forecast also uses the two scenarios to examine CO2 emissions anticipated through 2050. Under the more aggressive scenario, China’s emissions of the greenhouse gas are predicted to peak in 2027 at 9.7 billion metric tons. From then on, they will fall significantly, to about 7 billion metric tons by 2050. Under the more conservative scenario, CO2 emissions will reach a plateau of 12 billion metric tons by 2033, and then trail down to 11 billion metric tons at mid-century.
Several assumptions about China’s efforts to “decarbonize” its energy production and consumption are built into the optimistic forecasts for reductions in the growth of greenhouse gas emissions. They include:
* A dramatic reduction in coal’s share of energy production, to as low as 30 percent by 2050, compared to 74 percent in 2005
* An expansion of nuclear power from 8 gigwatts in 2005 to 86 gigawatts by 2020, followed by a rise to as much as 550 gigawatts in 2050
* A switch to electric cars. The assumption is that urban private car ownership will reach 356 million vehicles by 2050. Under the “continued improvement scenario,” 30 percent of these will be electric; under the “accelerated improvement scenario,” 70 percent will be electric.
Among the different sensitivity analysis tested, variables in the industrial sector had the largest impact on total primary energy use, implying that there is a higher level of uncertainty surrounding these variables. For example, a 25% increase in the growth rate of “other industry” GDP, which directly affects steel production, results in an increase of nearly 800 Mtce by 2050 in total primary energy use. Likewise, uncertainties in the production of heavy industrial output and energy intensity of other industry subsector results in changes in total primary energy use in the range of 300 to 700 Mtce in 2050 in our scenarios. As important drivers of energy demand, commercial floorspace and GDP growth rate are also highly sensitive variables that have important impacts on total energy use.
Aggregate results
* Future energy demand reduction potential (CIS minus AIS) is greatest in the industry sector in the earlier years and in the buildings sector in the long run.
* The total national CO2 emissions mitigation potential of moving from a CIS to AIS trajectory of development is 3.8 billion tonnes in 2050 with the power sector having the greatest mitigation potential. In 2050, over 70% of the inter-sector mitigation is from the power sector whereas 12% is from the transport sector.
* Both the CIS and AIS scenarios suggest that the goal of 40% to 45% carbon intensity reduction by 2020 announced in 2009 is possible. It will, however, require strengthening or expansion of energy efficiency policies in industry, buildings, appliances, and motor vehicles, as well as further expansion of renewable and nuclear power capacity.
* The share of coal will be reduced from 74% in 2005 to about 47% by 2050 in CIS, and to 30% in AIS. Coal demand in CIS will approach its peak in the late 2020s and reach it in 2031 at 3,000 Mtce. Most of the increase in crude oil demand is driven by a burgeoning transport sector with a growing share of oil demand. While other sectors have declining shares of total oil final demand, the transport sector will reach 66% share of oil demand in 2050 in CIS. This is comparable to the current U.S. transport share of 69%.
* The commercial building sector’s emerging role as a major energy consumer is most evident in the rise of final electricity demand, more than offsetting industry’s declining share. Under CIS, the commercial sector will be responsible for nearly one-third of all electricity demand. Under AIS, the transport sector has growing share of electricity demand because of more aggressive rail and road electrification.
* Saturation effects are important in this outlook. The saturation of commercial space per employee reduces construction of commercial space. This in turn has a very significant effect on the demand for steel and cement. Similarly, the saturation of fertilizer use per hectare of land results in a flattening of chemical fertilizer production from ammonia. In contrast, expected growth in per-capita consumption of plastic supports strong continued growth in ethylene production. Appliance sales and expansion of urban areas also drive electricity demand.
* Heavy-industrialization-led energy demand growth approach a peak in the short term of 2015 for both CIS and AIS, and industrial energy use will gradually decline as a proportion of the total as transportation and building energy use growth dominate demand through 2050.
Industry
* In spite of the relative decline in energy consumption of the energy-intensive industry sectors, they it still account for 47% of total industry energy consumption in 2050 in CIS, down from 61% in 2005 in CIS scenario. All energy-intensive subsectors decline in energy use over time except the ethylene subsector. Under AIS, the largest subsector potential for energy savings is in iron and steel, followed by non-heavy industry and cement.
Residential Buildings
* Although the ownership of many appliances has reached saturation in urban areas, new sales remain strong with increasing urbanization, with over 470 million additional people expected to become urban residents by 2050. As a result, electricity use from appliances will grow rapidly. Urban fuel consumption from space heating will more than double, due to increases in rural population and heating intensity in both CIS and AIS.
Commercial Buildings
* Energy demand in the commercial sector is currently growing rapidly, but there will be a slowing of growth in the medium term, reaching a plateau by about 2030. Total commercial building floorspace may saturate in the short term, but end-use intensity continues to have much room to grow before reaching current levels in industrialized countries. In particular, lighting, office equipment and other plug loads in commercial buildings will grow dramatically through 2030, but level off thereafter in CIS.
Transportation
* Urban private car ownership is expected to increase to over 356 million by 2050, with 30% of these being electric cars under CIS. Increasing this proportion to 70% in the AIS scenario reduces gasoline demand by 82 million tonnes in 2050. This produces the unintended result that China becomes a gasoline exporter, as demand for other oil products is not reduced commensurately. Energy use for freight transport remains important in both scenarios and has a strong impact on the structure of petroleum demand. Although foreign trade becomes less important in 2050 as China relies more on domestic demand, bunker fuel (heavy oil) demand will continue to rise strongly. Increased fuel efficiency of trucks for road freight, higher levels of electrification of the rail system, and more efficient inland and coastal ships moderate diesel demand growth, but diesel remains the largest share of petroleum product demand.
* Power decarbonization has important effects on the CO2 emissions mitigation potential of switching to electric vehicle (EV) technology. Greater transport electricity use under AIS could result in net CO2 emissions reduction on the order of 5 to 10 Mt CO2 per year before 2030 and as much as 109 Mt CO2 by 2050 because AIS power supply is less carbon intensive than CIS power supply. However, in the absence of any decarbonization in the power sector, EVs will increase CO2 emissions.
Energy Production
* Energy use to produce energy continues to increase from current levels of 150 Mtce to over 360 Mtce in 2030 under CIS. It will increase to 325 Mtce in 2030 and 310 Mtce in 2050 under AIS. This is equivalent to 17% to 19% of total industrial energy use. Energy used in energy extraction and processing in 2050 is led by the petroleum refining and coal mining sectors, together responsible for 70% of fuel use for energy extraction and processing. With the decline in availability of the “easily accessible” coal reserves, energy investment per unit of coal extracted will increase, and with the decline in average quality of crude oil for refining and increasingly stringent product quality specification, unit refinery energy use will rise.
* Decarbonization also plays a significant role in CO2 emission reduction in the power sector, primarily from the increase in nuclear, hydropower and renewable generation.
* One of the largest power sector mitigation potentials is from end-use efficiency improvements that lower final electricity demand and the related CO2 emissions, which is about half of total CO2 savings from electricity before 2030 and one-third of total CO2 savings from electricity by 2050. Another growing source of carbon mitigation potential is the rapid expansion of nuclear generation, which increases from accounting for only 5% of CO2 savings in 2030 to almost 40% in 2050.
* Of the CO2 savings from power sector technology and fuel switching, greater shifts in coal generation technology (i.e., greater use of supercritical coal generation) and higher renewable and hydropower capacity each contribute similar magnitude of savings by 2050.
Energy Supply
* In both scenarios, China remains a net importer of oil and natural gas and becomes highly dependent on imports by 2050 (over 97%) based on its remaining proven oil and gas reserve base. Even with substantial expansion of proven reserves, China’s import dependency would remain over 75% in 2050.
* China’s remaining extractable coal reserves appear to accommodate extraction levels up to over 4 billion tonnes per year, meeting CIS demand, for only for a relatively short period; unless China’s reserves turn out to be larger than current estimates, China will be increasingly dependent on coal imports in the long run (after 2050). At lower levels of extraction such as under the AIS scenario, domestic reserves may be sufficient and will last considerably longer
If you liked this article, please give it a quick review on ycombinator or StumbleUpon. Thanks

Brian Wang is a Futurist Thought Leader and a popular Science blogger with 1 million readers per month. His blog Nextbigfuture.com is ranked #1 Science News Blog. It covers many disruptive technology and trends including Space, Robotics, Artificial Intelligence, Medicine, Anti-aging Biotechnology, and Nanotechnology.
Known for identifying cutting edge technologies, he is currently a Co-Founder of a startup and fundraiser for high potential early-stage companies. He is the Head of Research for Allocations for deep technology investments and an Angel Investor at Space Angels.
A frequent speaker at corporations, he has been a TEDx speaker, a Singularity University speaker and guest at numerous interviews for radio and podcasts. He is open to public speaking and advising engagements.