


We have no readings for Tokyo, but we do have some in Kanagawa Prefecture (thank you GNF – Global Nuclear Fuel), which is right next to it. You can also get 7-day graphs of dose. But each monitoring station is different and there are 12 of them in Kanagawa Prefecture, and it turns out that matters a great deal to both the background dose and the profile of the elevated radiation levels. I apologize for the quality, but here is my mashup.
The levels of radiation are the area underneath the fluctuating line. It is not the height of the line but the area underneath that is the dose. The overall dose is what would effect health.
Readings of a geiger counter in Tokyo. Thanks to a reader

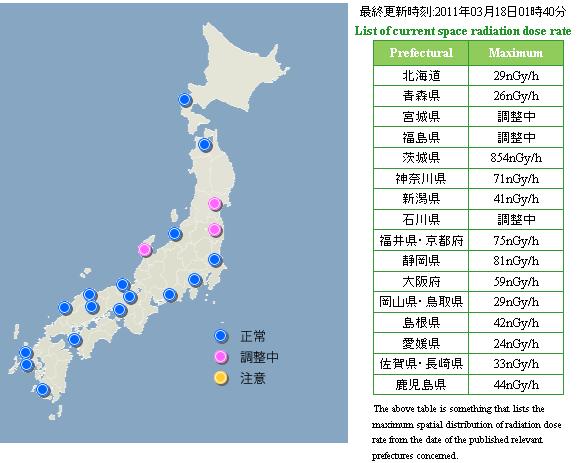
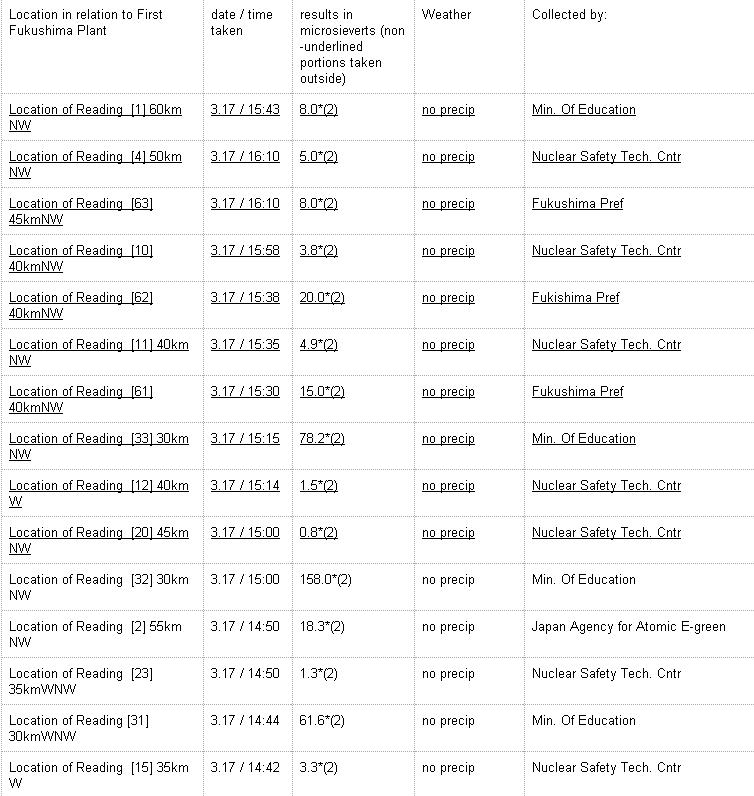
Some translation of radiation readings from the Ministry of Education radiation monitoring sites.
If you liked this article, please give it a quick review on ycombinator or StumbleUpon. Thanks

Brian Wang is a Futurist Thought Leader and a popular Science blogger with 1 million readers per month. His blog Nextbigfuture.com is ranked #1 Science News Blog. It covers many disruptive technology and trends including Space, Robotics, Artificial Intelligence, Medicine, Anti-aging Biotechnology, and Nanotechnology.
Known for identifying cutting edge technologies, he is currently a Co-Founder of a startup and fundraiser for high potential early-stage companies. He is the Head of Research for Allocations for deep technology investments and an Angel Investor at Space Angels.
A frequent speaker at corporations, he has been a TEDx speaker, a Singularity University speaker and guest at numerous interviews for radio and podcasts. He is open to public speaking and advising engagements.