

Most economists choose to measure the middle class in terms of income or consumption levels.
Taking an absolute approach, a recent study defined the global middle class as those households with daily expenditures between $10 and $100 per person in purchasing power parity terms. The lower bound is chosen with reference to the average poverty line in Portugal and Italy, the two advanced European countries with the strictest definition of poverty.
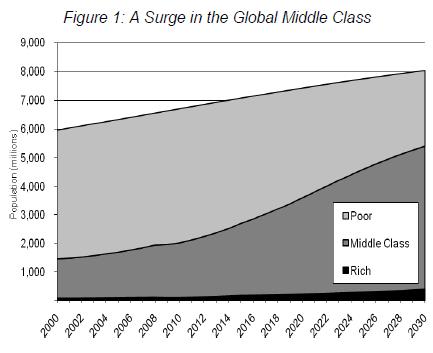
Today, 1.8 billion people in the world are middle class, or 28 percent of the global
population. About half of these people live in developed economies, with another fifth found in Brazil, Russia, India, and China – the so-called emerging BRIC economies. Less than 2 percent of the world’s population is rich by our definition; a significant majority, 70 percent, is poor.
2022 marks the first year more people in the world are middle class than poor. By 2030, 5 billion people – nearly two thirds of global population – could be middle class.
NOTE- this Brookings Institute analysis from 2010 uses the World Bank 2005 PPP figures which probably understate China’s PPP GDP by 27% versus updated Penn World Tables 7.0 numbers and India’s by 13%. Correcting the PPP GDP figures would mean more people in China and India are middle class already and more will become middle class earlier.

The middle class can be defined in relative or absolute terms. Easterly and Birdsall and Graham and Pettinato take a relativist approach, defining the middle class as those between the 20th and 80th percentile of the consumption distribution and between 0.75 and 1.25 times median per capita income, respectively. Bhalla takes an absolute approach, defining the middle class as those with annual incomes over $3900 in purchasing power parity terms. Banerjee and Duflo use two alternative absolute measures—those with daily per capita expenditures between $2 to $4 and those with daily per capita expenditures between $6 and $10—as estimates of a lower and upper middle class in developing countries.
The choice between these two approaches depends on the purpose at hand. As we are
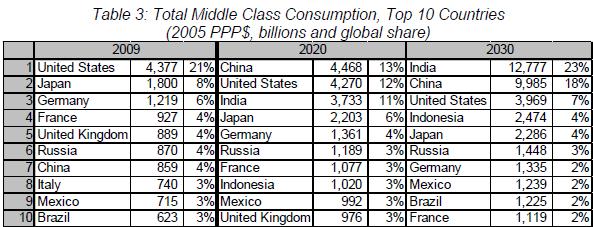
considering comparisons across different countries on the size of the middle class, it makes sense to take an absolute approach. Obviously, such comparisons require a common definition of the middle class in all countries. It would make no sense to compare Indians earning $2 per day with Americans earning $50 per day and claim that both are comparable in terms of purchasing power because both are middle class.In our scenario, China, which accounts for only 4 percent of global middle class spending today (enough to be the 7th largest middle class country in the world) could catapult up the global table to become the largest single middle class market by 2020, surpassing the United States. In fact, China’s middle class market in 2020 could exceed that of the U.S. today. But China itself might be overtaken in the following decade by India, thanks to that country’s more rapid population growth and more even income distribution that permits growth to be distributed across all segments of society.
Using a more restrictive definition of middle class, the World Bank’s 2007 Global
Economic Prospects report estimated that the global middle class would expand from 7.6 percent of the world’s population in 2000 to between 16.1 and 19.4 percent of the world’s population by 2030. A recent report from Goldman Sachs found that the global middle class would expand from 29 percent of world population in 2008 to approximately 50 percent in 2030.


If you liked this article, please give it a quick review on ycombinator or StumbleUpon. Thanks

Brian Wang is a Futurist Thought Leader and a popular Science blogger with 1 million readers per month. His blog Nextbigfuture.com is ranked #1 Science News Blog. It covers many disruptive technology and trends including Space, Robotics, Artificial Intelligence, Medicine, Anti-aging Biotechnology, and Nanotechnology.
Known for identifying cutting edge technologies, he is currently a Co-Founder of a startup and fundraiser for high potential early-stage companies. He is the Head of Research for Allocations for deep technology investments and an Angel Investor at Space Angels.
A frequent speaker at corporations, he has been a TEDx speaker, a Singularity University speaker and guest at numerous interviews for radio and podcasts. He is open to public speaking and advising engagements.