

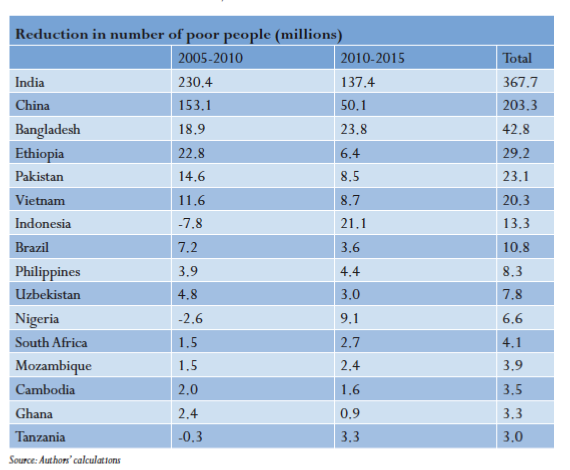
By 2015, we will not only have halved the global poverty rate, but will have halved it again to under 10 percent, or less than 600 million people, with India and China responsible for three-quarters of the reduction in the world’s poor expected between 2005 and 2015.
23 pages – Poverty in Numbers: The Changing State of Global Poverty from 2005 to 2015
How many poor people are there in the world and how many are there likely to be in 2015?
To calculate the number of people in the world living in extreme poverty, we update the World Bank’s official $1.25 a day poverty estimates for 119 countries, which together account for 95 percent of the population of the developing world. To do this, we take the most recent household survey data for each country, and generate poverty estimates for the years 2005 to 2015 using historical and forecast estimates of per capita consumption growth, making the simplifying assumption that the income distribution in each country remains unchanged. Global poverty figures are then calculated by adding together the number of poor from each country. (See the Appendix for a full account of our methodology.)
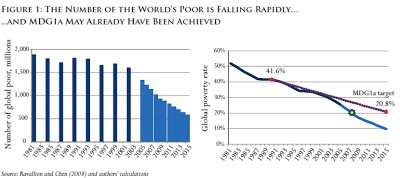
Our results indicate that the world has seen a dramatic decrease in global poverty over the past six years, and that this trend is set to continue in the four years ahead. We estimate that between 2005 and 2010, the total number of poor people around the world fell by nearly half a billion people, from over 1.3 billion in 2005 to under 900 million in 2010. Looking ahead to 2015, extreme poverty could fall to under 600 million people—less than half the number regularly cited in describing the number of poor people in the world today. Poverty reduction of this magnitude is unparalleled in history: never before have so many people been lifted out of poverty over such a brief period of time.
When measured as a share of population, progress remains impressive, but is more in line with past trends. In the early 1980s, more than half of all people in developing countries lived in extreme poverty. By 2005, this was down to a quarter. According to our estimates, as of 2010 less than 16 percent remained in poverty, and fewer than 10 percent will likely be poor by 2015.
The first Millennium Development Goal defines a target (MDG1a) of halving the rate of global poverty by 2015 from its 1990 level. In an official report prepared for the U.N. MDG conference this past September, the World Bank stated that we are 80 percent of the way toward this target and are on track to meet it by 2015, though the Bank warned that “the economic crisis adds new risks to prospects for reaching the goal.”
Our assessment is considerably more upbeat. We believe that the MDG1a target has already been met—approximately three years ago. Furthermore, by 2015, we will not only have halved the global poverty rate, as per MDG1a, but will have halved it again.
Over the past half century, the developing world, including many of the world’s poorest countries, have seen dramatic improvements in virtually all non-income measures of well-being: since 1960, global infant mortality has dropped by more than 50 percent, for example, and the share of the world’s children enrolled in primary school increased from less than half to nearly 90 percent between 1950 and today.5 Likewise there have been impressive gains in gender equality, access to justice and civil and political rights. Yet, through most of this period, the incomes of rich and poor countries diverged, and income poverty has proven a more persistent challenge than other measures of wellbeing. The rapid decline in global poverty now underway—and the early achievement of the MDG1a target—marks a break from these trends, and could come to be seen as a turning point in the history of global development.

Unlike previous decades, like the ’80s (when the poverty rate increased in Africa) and the ’90s (when it increased in Latin America and the former Soviet Union), poverty reduction is currently taking place in all regions of the world. The sharpest fall in poverty is occurring in Asia. South Asia alone is expected to see a reduction in the number of its poor of more than 430 million over the 10-year period we study, representing a fall in its poverty rate of over 30 percentage points. East Asia already recorded a vast drop in poverty between 1980 and 2005, and this trend is continuing: a further 250 million people in the region are expected to escape poverty by 2015, two-thirds of whom have likely already done so.
For the first time, Sub-Saharan Africa’s poverty rate has fallen below 50 percent. The total number of poor people in the region is falling too, albeit slowly. Better still, by 2015, the poverty rate is expected to fall below 40 percent—a rate China did not achieve until the mid-90s.
Countries moving from Low Income Classification to Middle Income
2007 India moved from LIC to MIC
2008 Nigeria and Pakistan moved from LIC to MIC
India, Nigeria and Pakistan had two-fifths of the world’s poor at that time
The share of the world’s poor residing in LICs hit a low of 33.4 percent in 2009 with the graduation of Vietnam from LIC to MIC. The continuing reduction of poverty in China, India, Nigeria, Pakistan and Vietnam will cause the share of poor in LIC to go back up to 44.9 percent in 2015.
Comparing to World Bank Statistics
In its role as the official monitor of global poverty, the World Bank produces poverty forecasts of its own, employing a sophisticated economic model which enables it to project poverty rates many years into the future. While such tools can make important contributions to economic analyses, it is not clear that the Bank’s approach is particularly well suited to the task of modeling medium-term changes in poverty levels. Our admittedly more simple approach has the advantage of incorporating the most recently available data and applying country-specific consumption growth forecasts.
For the majority of the world’s regions, our numbers are quite similar to those of the Bank; the discrepancies in projections for Europe and Central Asia, Latin America and the Caribbean, the Middle East and North Africa, and Sub-Saharan Africa are minor for an exercise as necessarily speculative as this one. Yet for China and India, the differences are substantial. While our model suggests China will all but have escaped poverty by 2015, with India following not far behind, the changes forecast by the World Bank are much more conservative. Indeed, the World Bank’s 2015 projections for these two countries are even higher than our poverty estimates for 2010.
With such large discrepancies between the two sets of poverty forecasts for China and India, it is worth examining in greater detail whether our numbers for these countries are realistic.
It will be difficult for some to believe that China has nearly succeeded in escaping poverty. After all, as recently as 1996 the country was home to the largest number of poor people in the world. Yet while the reduction in poverty we forecast for China is dramatic, it is no more so than the country’s recent meteoric growth performance or indeed its own past record in poverty reduction. Consider, for example, that in the three years between 2002 and 2005, China’s poverty rate fell by 12.5 percentage points, from 28.4 percent to 15.9 percent. In this light, the further decrease of 15.6 percentage points that we project between 2005 and 2015 does not seem so farfetched.
In fact, the World Bank’s own East Asia and Pacific Department found that as of 2007 “extreme poverty, in the sense of not being able to meet the most elementary food and clothing needs, has almost been eliminated [in China].” On this basis it seems reasonable to believe that the country could effectively eliminate $1.25 a day poverty within the coming four years.
Turning to India, our estimates show an even more remarkable reduction in poverty and an even larger divergence from the World Bank’s projections. We estimate that India could see a decrease in its poverty rate of 34.6 percentage points over the span of 10 years, dropping from 41.6 percent all the way to 7.0 percent between 2005 and 2015. Such a rapid decrease in poverty on such a grand scale and over such a short period would constitute an almost unparalleled achievement in history. Almost, because China experienced nearly an identical drop in poverty a decade earlier: in the 12 years between 1993 and 2005, China reduced its poverty rate by 37.8 percentage points
Policy Implications
* As alleviating poverty is at the heart of foreign assistance efforts, aid donors must adapt to the evolving poverty landscape and update their policies and programming to reflect current needs and priorities.
* Our results suggest that providing every person in the world with a minimum income of $1.25/day—in other words guaranteeing the right not to live in absolute poverty—is rapidly becoming feasible.
* Our evidence suggests that there are two particular areas on which aid agencies should be focusing their attention over the medium term: Sub-Saharan Africa and fragile states.
* At the global level, one concrete policy recommendation that could be implemented immediately is for the World Bank to begin producing global poverty estimates every year. The World Bank currently produces updated poverty estimates every three to four years, and each new release suffers from a three-year lag attributable to time spent on data collection and analysis. This means that when we are near the end of the data production cycle—as we hopefully are today—our estimates of “current” global poverty are six years out of date.
Methodology
Our estimates are based on the 119 countries for which the World Bank provides household survey data. For each country, we take the most recently available survey data, which in most cases are found in the PovcalNet database. Where more recent survey data is available, we use the World Development Indicators (WDI) database.
For each country, we produce a set of estimates of mean per capita private consumption for the years 2005-2015. We do so by applying the Economist Intelligence Unit’s (EIU) historical, estimated and forecast growth rates of per capita private consumption (national accounts data) to the survey mean per capita consumption level for each country. (For survey data taken from the WDI database, the mean consumption level is derived using the income distribution, the poverty headcount ratio and the poverty gap.) The EIU provides private consumption growth data for 113 of our 119 countries up to 2011, and for 46 of the largest economies up to 2014. Where EIU private consumption growth data is not available, we use GDP per capita growth forecasts from the IMF’s World Economic Outlook (WEO) database as a proxy for per capita private consumption growth.
Next, we use our per capita private consumption data to estimate the poverty headcount ratio and poverty gap for every country for the years 2005-2015. We do so using the World Bank’s PovcalNet software. The PovcalNet software generates a headcount ratio and poverty gap for any given poverty line, mean consumption level and income distribution. Keeping the poverty line fixed at the international poverty line of $1.25 a day measure in purchasing power parity (PPP) terms, and the income distribution fixed according to that of the most recent household survey for each country, we calculate changes in poverty based on the changes in mean private consumption per capita. (For countries which have had more than one survey since 2005, we use the most recent survey to forecast forward changes in poverty, use data directly from earlier surveys for each survey year, and average data for the years in between surveys. For example, if a country has survey data for the years 2005 and 2007, the 2005 headcount ratio and poverty gap will come directly from the 2005 survey, the 2006 headcount ratio and poverty gap will be an average of the 2005 and 2007 data, and the 2007 survey data will then be used as the basis for determining and estimating values for the years 2007-2015.)
The final step is to estimate the number of people living in poverty in each country, which simply requires combining our poverty headcount ratios with population data. For the years up to 2009, we use population data from the WDI; for the years 2010-2015, we apply population growth rates from the IMF’s WEO database to the WDI data. The lone exceptions are China and India, where, in order to derive separate data for rural and urban populations, we apply population growth rates from the U.N. Urbanization Prospects database to 2005 population data derived from PovcalNet.
Our methodology implicitly assumes that the income distribution in each country remains constant over the forecast period. While in reality this is unlikely to hold, and for any given country our estimates might overstate or understate the true level of poverty based on changes in the income distribution, it is the best assumption that can be made given the absence of any systematic relationship between growth and the distribution of consumption or income. From a practical standpoint, the large terms of trade improvement in favor of the world’s rural populations recorded over the past decade gives us confidence that many of the world’s poor have shared in the benefits of the recent economic expansion.
If you liked this article, please give it a quick review on ycombinator or StumbleUpon. Thanks

Brian Wang is a Futurist Thought Leader and a popular Science blogger with 1 million readers per month. His blog Nextbigfuture.com is ranked #1 Science News Blog. It covers many disruptive technology and trends including Space, Robotics, Artificial Intelligence, Medicine, Anti-aging Biotechnology, and Nanotechnology.
Known for identifying cutting edge technologies, he is currently a Co-Founder of a startup and fundraiser for high potential early-stage companies. He is the Head of Research for Allocations for deep technology investments and an Angel Investor at Space Angels.
A frequent speaker at corporations, he has been a TEDx speaker, a Singularity University speaker and guest at numerous interviews for radio and podcasts. He is open to public speaking and advising engagements.