

The December 10, 2010 IEA world oil supply report is here (71 pages)
Global oil product demand is revised up by 0.13 Mbbl/d to 87.4 Mbbl/d in 2010 (actual), and projected to rise 0.26 Mbbl/d to 88.8 Mbbl/d in 2011, on stronger data from OECD North America and non-OECD Asia. Growth in 2010 (up 2.5 Mbbl/d year-over-year) was largely driven by buoyant gasoil (diesel & jet fuel) demand, notably in 3Q10, but expansion should slow to an increase of 1.3 Mbbl/d in 2011 as temporarily supporting factors fade.
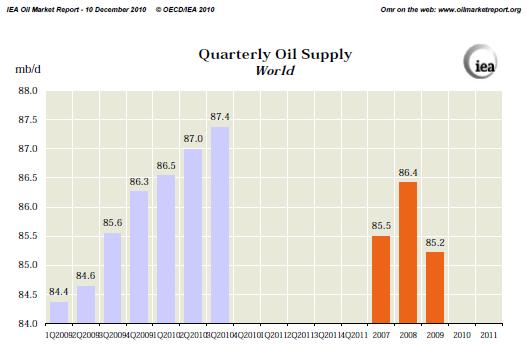
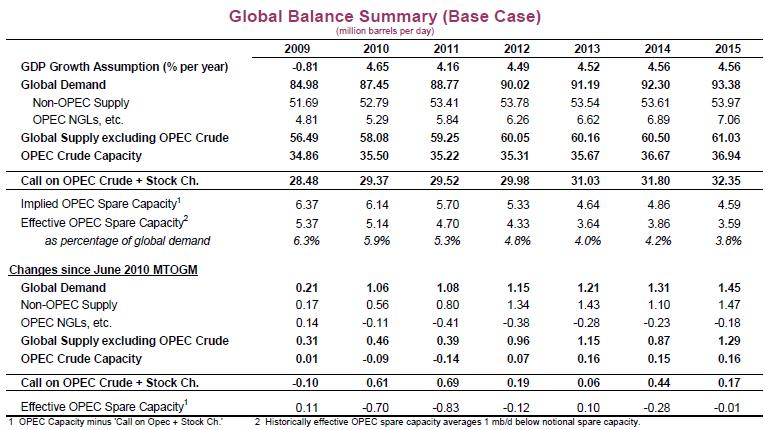
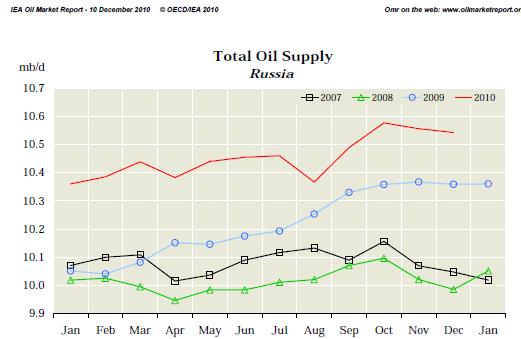
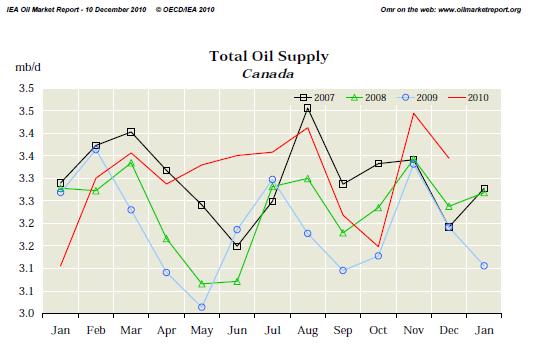
Global oil supply rose 0.4 Mbbl/d to 88.1 Mbbl/d in November, largely due to increased non-OPEC production, notably from Canada, Kazakhstan and Brazil. Non-OPEC supply now averages 52.8 Mbbl/d (59.9%) in 2010 and is projected at 53.4 Mbbl/d (over 60%) in 2011, representing growth of 1.1 Mbbl/d and 0.6 Mbbl/d, respectively. OPEC NGLs (natural gas liquids) output is seen averaging 5.3 Mbbl/d this year and 5.8 Mbbl/d in 2011.
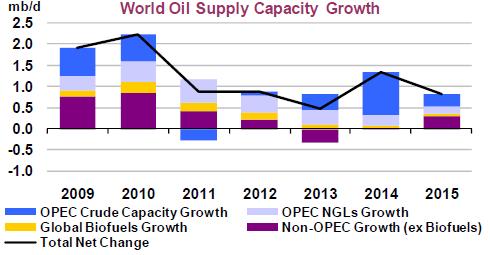
Non-OPEC supply is projected to grow through 2015, reaching 54.0 Mbbl/d. However, conventional crude oil (increasing in Brazil, Colombia, the Caspian and Russia) generates only around 10% of expected non-OPEC growth (0.255 Mbbl/d for 2009-2015), with most of the rise instead attributed to biofuels (up 0.8 Mbbl/d for 2009-2015, to reach 2.4 Mbbl/d), oil sands, NGLs and other liquids.
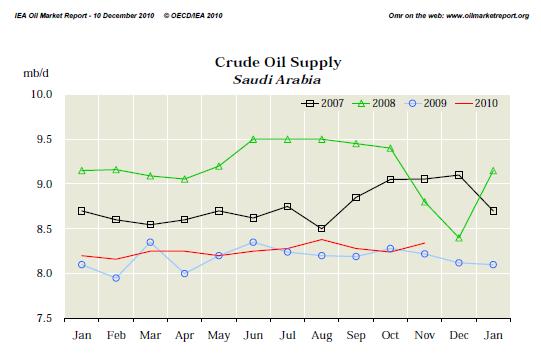
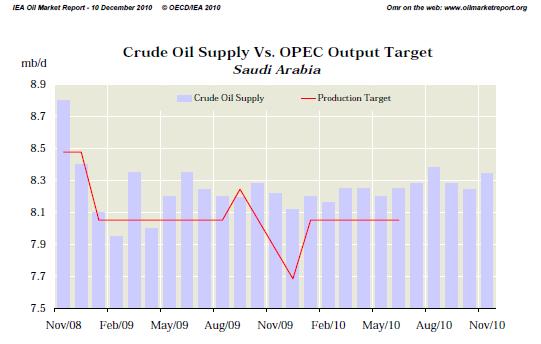
The expected profile for OPEC crude production capacity remains similar to that in June, with a net increase of 2.1 Mbbl/d to 36.9 Mbbl/d now expected, compared with an equivalent gain of 1.9 Mbbl/d six months ago. While difficulties remain, the outlook for both Iraq and Nigeria has improved marginally. But among OPEC and non-OPEC producers alike, local engineering content contract clauses are causing bottlenecks and delays. All told, Iraq (increasing 1.1 Mbbl/d), the UAE (increasing 0.5 Mbbl/d), Angola (increasing 0.4 Mbbl/d), Saudi Arabia (increasing 0.4 Mbbl/d) and Libya (increasing 0.2 Mbbl/d) generate the bulk of capacity growth. Meanwhile, expectations for Iran have soured, with capacity expected to fall from 3.9 Mbbl/d to 3.1 Mbbl/d by 2015 as reinforced sanctions delay new projects and accelerate field decline.
Specific Country Production up to Nov 2010

If you liked this article, please give it a quick review on ycombinator or StumbleUpon. Thanks
Featured articles
Ocean Floor Gold and Copper
Ocean Floor Mining Company

Brian Wang is a Futurist Thought Leader and a popular Science blogger with 1 million readers per month. His blog Nextbigfuture.com is ranked #1 Science News Blog. It covers many disruptive technology and trends including Space, Robotics, Artificial Intelligence, Medicine, Anti-aging Biotechnology, and Nanotechnology.
Known for identifying cutting edge technologies, he is currently a Co-Founder of a startup and fundraiser for high potential early-stage companies. He is the Head of Research for Allocations for deep technology investments and an Angel Investor at Space Angels.
A frequent speaker at corporations, he has been a TEDx speaker, a Singularity University speaker and guest at numerous interviews for radio and podcasts. He is open to public speaking and advising engagements.