

The maximum values are plus or minus 10% for GDP growth, inflation and currency appreciation.
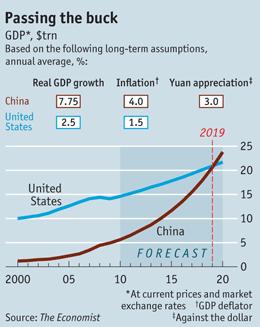
Over the past decade annual inflation (as measured by the GDP deflator) has averaged 3.8% in China against 2.2% in America. And since China ditched its strict dollar peg in 2005 the yuan has risen by an annual average of 4.2%.
I have predicted that China will pass in 2016-2018.
My most likely date is 2017.
China GDP growth averaging 8.5, combined inflation and yuan appreciation of 10%.
US with growth of about 2-3%.
Inflation and yuan appreciation could be 8.5% and the date would still be 2017.
China GDP growth could slow to 6.5% per day witha combined inflation and yuan appreciation of 8.5% and the date would be 2018 (with moderately slow US growth).
Projected GDP:
Year GDP(yuan) GDP growth USD/CNY China GDP China+HK US GDP  US Growth

2011e 42            9.6    6.49       6.47      6.7   14.9   2
2012 45             9      6          7.5       7.7   15.1   2.1
2013 49             9      5.6        8.7       8.9   15.4   3
2014 53             9      5.1       10.4      10.7   15.7   3
2015 58             9      4.7       12.3      12.6   16     3
2016 63             9      4.4       14.3      14.7   16.4   3
2017 68             8      4         17.0      17.3   16.8   3 Past USA
2018 74             8      3.7       19.9      20.2   17.2   3
2019 80             8      3.4       23.5      23.8   17.6   3
2020 86             8      3         28.6      28.9   18.1   3
2021 93             8      3         30.9      31.2   18.7   3
2022 100            8      3         33.4      33.7   19.2   3
2023 108            8      3         36.0      36.3   19.8   3
2024 117            8      3         38.9      39.2   20.4   3
2025 126            8      3         42.0      42.3   21.0   3
2026 136            7      3         45.4      45.7   21.6   3
2027 146            7      3         48.6      48.9   22.3   3
2028 156            7      3         52.0      52.3   23.0   3
2029 167            7      3         55.6      55.9   23.6   3
2030 179            7      3         59.5      59.8   24.4   3
var _phPubId = ‘dkr04’;
var _phWidth = ‘300’;
var _phHeight = ‘250’;
var _phBgColor = ‘#ebebeb’; // For background color
var _phBorderColor = ‘#999999’; // For border color
var _phTextColor1 = ‘#006699’; // For Link 1 color
var _phTextColor2 = ‘#333333’; // For Link 2 color
var url = ‘http://ph.affinity.com/ph-adcloud-m.js?’ + ‘h=’+escape(location.hostname) + ‘&pb=’ + escape(_phPubId);
document.write(unescape(“%3Cscript src='” + url + “‘ type=’text/javascript’%3E%3C/script%3E”));
If you liked this article, please give it a quick review on ycombinator or StumbleUpon. Thanks
Featured articles
Ocean Floor Gold and Copper
Ocean Floor Mining Company
var MarketGidDate = new Date();
document.write(”);

Brian Wang is a Futurist Thought Leader and a popular Science blogger with 1 million readers per month. His blog Nextbigfuture.com is ranked #1 Science News Blog. It covers many disruptive technology and trends including Space, Robotics, Artificial Intelligence, Medicine, Anti-aging Biotechnology, and Nanotechnology.
Known for identifying cutting edge technologies, he is currently a Co-Founder of a startup and fundraiser for high potential early-stage companies. He is the Head of Research for Allocations for deep technology investments and an Angel Investor at Space Angels.
A frequent speaker at corporations, he has been a TEDx speaker, a Singularity University speaker and guest at numerous interviews for radio and podcasts. He is open to public speaking and advising engagements.
No comment for this article in the 10 years its been on here.
Not surprising.